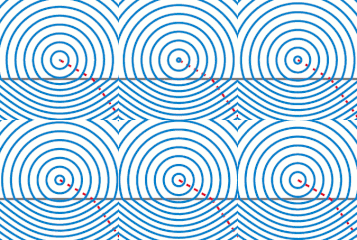
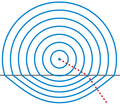
Datei:Snells law wavefronts.gif

Seiteninhalte werden in anderen Sprachen nicht unterstützt.
Faan Wikipedia

Snells_law_wavefronts.gif(225 × 227 pixels, dateigrate: 65 KB, MIME-typ: image/gif, sleuf saner aanj, 10 bilen, 0,1 s)

Detheer bil as faan Wikimedia Commons an koon faan ööder projekten brükt wurd. Det beskriiwang faan't beskriiwangssidj woort oner uunwiset.

Titel

Beskriiwang

 
Dieses Diagramm wurde mit MATLAB erstellt.
Beskriiwang
English: Illustration of wavefronts in the context of Snell's law.
Dootem (UTC)
Kwel Own work, created with MATLAB. (Source code below.)
Skriiwer of Konstler Oleg Alexandrov
Ferloof
(Hü det datei brükt woort)
Public domain Ik haa a rochten üüb detdiar datei an du det frei üs public domain (för arken frei). Det täält uun arke lun.
Uun enkelt lunen mei det ei mögelk wees. Wan det so as:
Arken koon detdiar werk brük för wat hi wal, wan det uun sin lun rochtelk mögelk as.
Ööder wersioonen
File:Snells law wavefronts.svg ist eine vektorisierte Version dieses Bildes. Diese sollte an Stelle des Rasterbildes verwendet werden, sofern sie nicht schlechter ist.

File:Snells law wavefronts.gif → File:Snells law wavefronts.svg

Für weitere Informationen siehe Help:SVG.

In anderen Sprachen
Alemannisch  Bahasa Indonesia  Bahasa Melayu  British English  català  čeština  dansk  Deutsch  eesti  English  español  Esperanto  euskara  français  Frysk  galego  hrvatski  Ido  italiano  lietuvių  magyar  Nederlands  norsk bokmål  norsk nynorsk  occitan  Plattdüütsch  polski  português  português do Brasil  română  Scots  sicilianu  slovenčina  slovenščina  suomi  svenska  Tiếng Việt  Türkçe  vèneto  Ελληνικά  беларуская (тарашкевіца)  български  македонски  нохчийн  русский  српски / srpski  татарча/tatarça  українська  ქართული  հայերեն  বাংলা  தமிழ்  മലയാളം  ไทย  한국어  日本語  简体中文  繁體中文  עברית  العربية  فارسی  +/−
Neue Vektorgrafik

Source code

% Illustration of Snell's law
function main()

   % indexes of refraction
   n1=1.0;
   n2=1.5;

   sign = -1;% is the source up or down?
   O=[0, -1*sign];
   k=500;

   
% KSmrq's colors
   red    = [0.867 0.06 0.14];
   blue   = [0, 129, 205]/256;
   green  = [0, 200,  70]/256;
   yellow = [254, 194,   0]/256;
   white = 0.99*[1, 1, 1];
   black = [0, 0, 0];
   gray = 0.5*white;

   color1=red;
   color2=blue;
   color3=gray;
   lw = 3;
   
   plot_line=0;
   Theta=linspace(0, 2*pi, k);
   V=0*Theta; W=0*Theta;
   S0=7;
   spacing=0.45;
   p=floor(S0/spacing);
   S=linspace(0, S0, p+1);
   spacing=S(2)-S(1);
   
   num_frames = 10;
   for frame_iter=1:num_frames

      figure(1); clf; hold on; axis equal; axis off;

      % plot the interface between diellectrics
      L=1.2*S0;
      plot([-L, L], [0, 0], 'color', color3, 'linewidth', lw);
      
      
      % plot a ray
      plot_line=1;
      s=L;
      theta=pi/3; wfr(s, theta, n1, n2, O, sign, plot_line, color1, lw);

      % plot the wafefronts
      plot_line=0;
      for i=1:p

	 s=S(i)+spacing*(frame_iter-1)/num_frames;

	 for j=1:k
	    theta=Theta(j);
	    [V(j), W(j)]=wfr(s, theta, n1, n2, O, sign, plot_line, color1, lw);
	 end
	 plot(V, W, 'color', color2, 'linewidth', lw);
      end
      

      %  dummy points to enlarge the bounding box
      plot(0, S0+2.5*spacing, '*', 'color', white);
      plot(0, -(S0+2.5*spacing)/n2, '*', 'color', white);

      % to know where to crop later
      Lx=3.2; Ly=Lx; shift = 1;
      plot([-Lx, Lx, Lx, -Lx -Lx], ...
           [-Ly, -Ly, Ly, Ly, -Ly]+shift);

      file = sprintf('Frame%d.eps', 1000+frame_iter);
      disp(file);
      saveas(gcf, file, 'psc2')
   end
end

% Converted to gif with the UNIX command
% convert -density 100 -antialias Frame10* Snell_animation.gif 
% then cropped in Gimp

function [a, b]=wfr(s, theta, n1, n2, O, sign, plot_line, color1, lw);

   X=O+s*[sin(theta), sign*cos(theta)];

  if( sign*X(2) > 0 )
    t=-sign*O(2)/cos(theta);
    X0=O+t*[sin(theta), sign*cos(theta)];
    
    if (plot_line == 1) 
      plot([O(1), X0(1)], [O(2), X0(2)], 'color', color1, 'linewidth', lw, 'linestyle', '--');
    end

    d = norm(O-X0);
    r = (s-d)*(n2/n1)^(sign);

    theta2=asin(n1*sin(theta)/n2);
    XE=X0+r*[sin(theta2), sign*cos(theta2)];
  else
    XE = X;
  end  
  a = XE(1);
  b = XE(2); 

  if (plot_line==1)
    plot([X0(1), XE(1)], [X0(2), XE(2)], 'color', color1, 'linewidth', lw, 'linestyle', '--');
  end  
end

Kurzbeschreibungen

Ergänze eine einzeilige Erklärung, was diese Datei darstellt.
Wavefronts from a point source of light.In a particuler wavefront u will see that the dist btw source & wavefront above the line is > dist btw source & wavefront below the line beacuse lightspeed is greater in the above and lower in below.

In dieser Datei abgebildete Objekte

motiif

Urheber Tjiisk

Einige Werte ohne einen Wikidata-Eintrag

Datei wersioonen

Klike üüb en tidjponkt, am detdiar wersion uuntulukin.

Dootem/TidjFöörskaubilMiatenBrükerKomentaar
aktuel11:59, 5. Jul. 2009Föörskau för det wersion faan 11:59, 5. Jul. 2009225 × 227 (65 KB)Capmoreduced to 16 colors with no quality loss
08:31, 2. Jan. 2008Föörskau för det wersion faan 08:31, 2. Jan. 2008225 × 227 (148 KB)Oleg Alexandrov{{Information |Description=Illustration of wavefronts in the context of Snell's law. |Source=self-made with MATLAB |Date=05:36, 1 January 2008 (UTC) |Author= Oleg Alexandrov |Permission= |oth

Detdiar sidj brükt detdiar datei:

Globaal brük faan datein

Jodiar ööder Wikis brük detdiar datei:

Muar globaal brük faan detdiar datei.